
An SEO reporting dashboard should make the next SEO decision easier. It is not just a place to collect rankings, traffic, crawl warnings, and charts. The useful version shows what changed, where it changed, who owns the next action, and when the team will validate the result.
The Ahrefs SEO reporting dashboard article that surfaced this opportunity frames dashboards by website type: your own site, a small business, and an enterprise site. Searvora's information gain is the operating layer after the dashboard is sketched: how to connect page cohorts, AI-search evidence, crawl health, owner queues, and validation windows so the report drives shipped work.
Start With The Dashboard Decision
Before choosing widgets, decide what the dashboard should change. A dashboard for weekly diagnosis, executive status, local SEO, enterprise governance, and content refresh planning should not use the same layout.
Use this first-pass decision table:
| Dashboard job | What it should answer | What should happen next |
|---|---|---|
| Weekly SEO review | Which page groups moved and why? | Assign diagnosis or fixes by owner |
| Executive summary | Is organic work creating visible progress? | Confirm priorities, risks, and resourcing |
| Technical health | Are important pages crawlable and indexable? | Open focused crawl, canonical, sitemap, or template checks |
| AI-search visibility | Are target topics being mentioned or cited? | Improve source pages, definitions, evidence, and internal links |
| Content operations | Which pages need refresh, expansion, consolidation, or no action? | Route work into a content queue with validation dates |
This is where dashboard design differs from automated reporting. Automated SEO reporting explains how to make the reporting rhythm repeatable. This article is about the dashboard surface itself: what the team needs to see before it can act.
Design The Evidence Layers
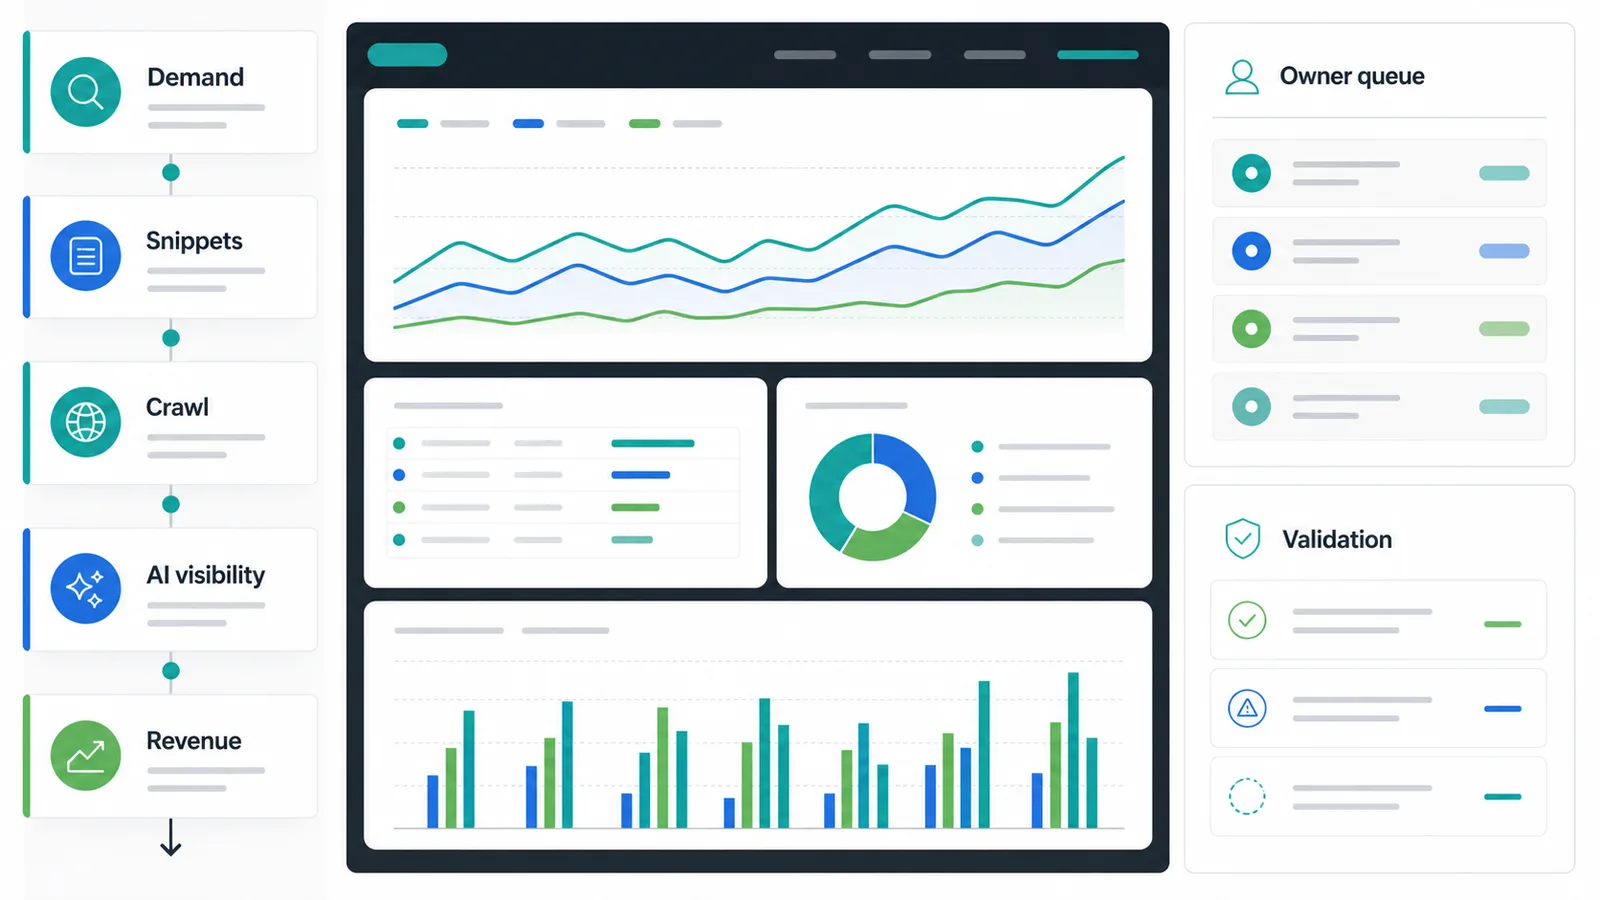
An action-ready dashboard needs evidence layers, not one blended score. If the dashboard mixes demand, snippets, crawl access, AI visibility, and revenue into a single performance color, the team still has to rebuild the diagnosis somewhere else.
Build the dashboard in layers:
| Evidence layer | Useful dashboard view | Bad shortcut to avoid |
|---|---|---|
| Demand | Clicks, impressions, query families, and page groups | Sitewide traffic line with no page-type split |
| Snippets | CTR, titles, descriptions, SERP layout notes, and affected URLs | Ranking movement with no click context |
| Crawl health | Indexability, canonicals, redirects, sitemap, robots, and internal links | Issue count with no template or owner |
| AI visibility | Prompt groups, mentions, citations, source pages, and missing evidence | Vague AI score with no cited URL |
| Revenue context | Page role, funnel stage, lead quality, and business priority | Last-click revenue treated as the only SEO value |
Google's Search Console performance report is still the baseline for query and page movement. The dashboard becomes more useful when that data is grouped by page type, directory, locale, market, and owner instead of left as a giant export.
For the metric selection layer, pair this workflow with SEO metrics to track. The metric article helps decide what deserves review; this dashboard workflow decides how those metrics become a fix path.
Change The View By Site Type
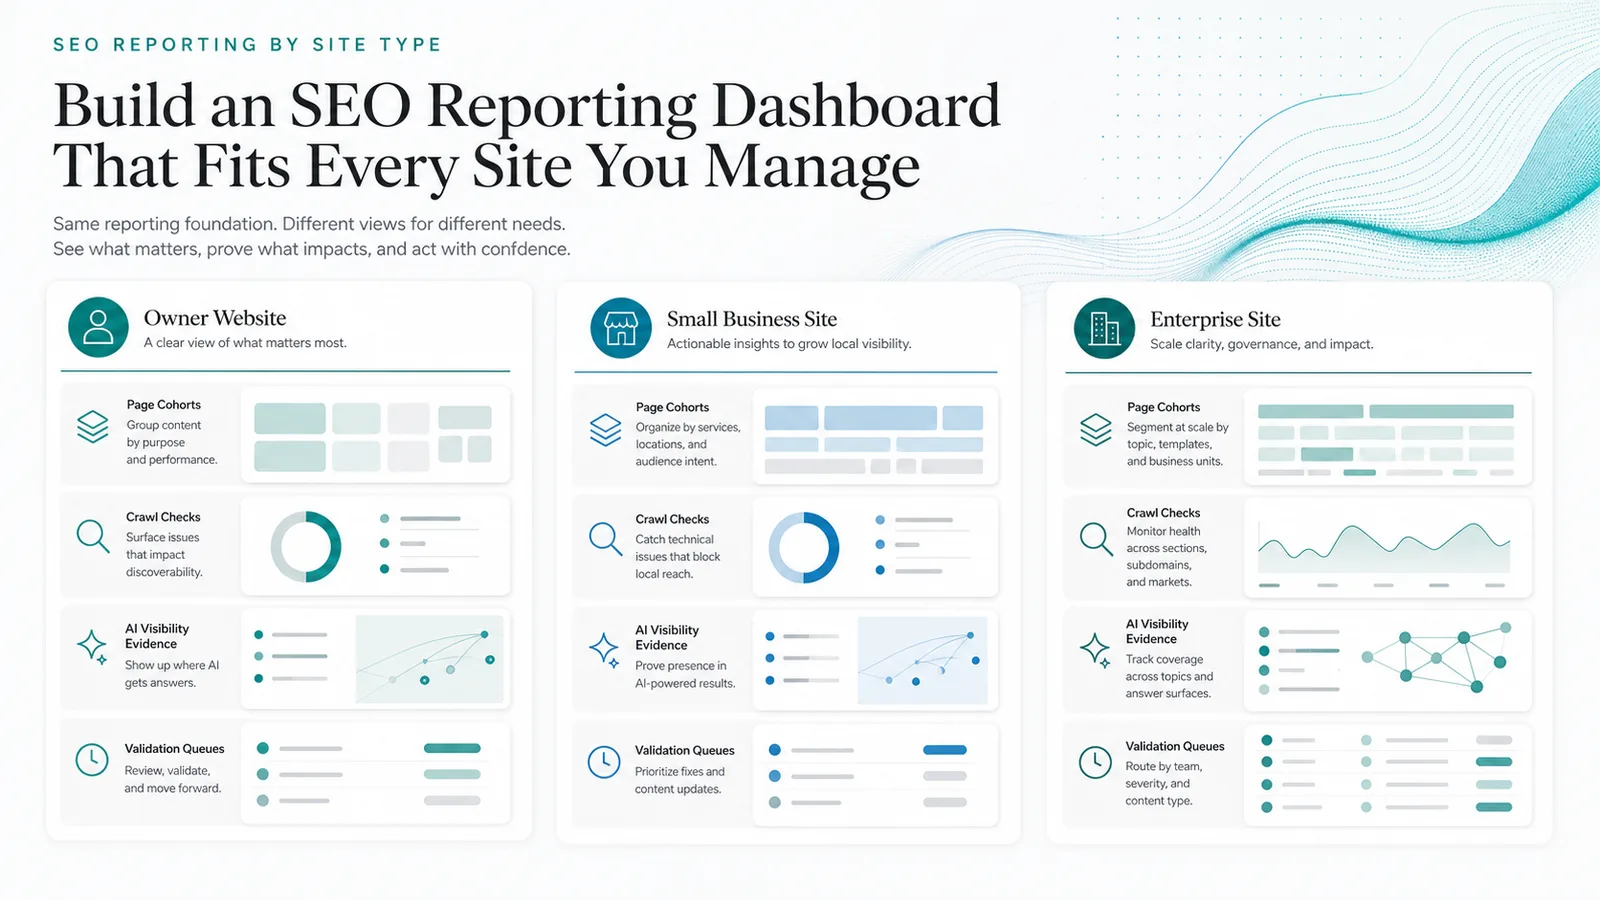
The same reporting foundation can serve different site types, but the dashboard view should change with the operating model.
| Site type | Dashboard emphasis | Why it matters |
|---|---|---|
| Owner website | Page cohorts, content opportunities, crawl eligibility, and one action queue | A small team needs speed and clarity more than governance layers |
| Small business site | Local/service pages, branded demand, map or market signals, reviews, and technical blockers | The dashboard must separate local visibility from generic traffic movement |
| Enterprise site | Templates, markets, locale routes, stakeholder owners, severity, and release windows | Scale creates duplicate issues unless dashboards group by structure and owner |
| Ecommerce or Shopify site | Collections, product pages, blog clusters, internal links, index coverage, and revenue context | SEO work must connect content and technical fixes to commercial page roles |
| SaaS or B2B site | Product pages, comparison pages, articles, demos, trials, and AI-search citations | The dashboard should show which page type supports pipeline or authority |
Do not overbuild the first version. A dashboard that lets the team segment pages, spot outliers, assign work, and validate shipped fixes is more valuable than a polished chart library that nobody owns.
Add AI Search And Crawl Signals
SEO reporting dashboards now need two evidence types that older reporting views often separate: AI-search visibility and crawl health.
AI-search evidence belongs in the dashboard when the team is trying to understand whether a brand, topic, or source page appears in AI answer surfaces. Track the prompt or query group, the answer surface observed, the cited sources, the owned page that should support the answer, and the next content or technical action. For a deeper workflow, use tracking AI Overviews as the measurement companion.
Crawl evidence belongs beside performance data because a ranking or traffic change is often a symptom. A page can lose visibility because the snippet promise changed, but it can also lose eligibility because of canonicals, redirects, robots rules, broken links, rendering, or sitemap drift. Put crawl health next to affected page cohorts so the first diagnosis does not become "rewrite content" by default.
Use this dashboard pattern:
| If the dashboard shows | Check next | Likely action |
|---|---|---|
| Impressions up, clicks flat | Snippet, intent fit, SERP layout, and title rewrites | Improve title, description, intro, or page angle |
| Clicks down in one directory | Template, canonical, internal links, and crawl access | Run a focused crawl and assign technical fixes |
| AI citations missing | Source-page clarity, entity naming, examples, and links | Add extractable definitions, evidence, and internal links |
| Crawled pages blocked or non-canonical | Robots, canonicals, redirects, sitemap, and internal links | Fix access before editing copy |
| Rankings move but business value is flat | Page type, CTA fit, funnel role, and query mix | Re-route intent or change the next action |
Turn Widgets Into An Owner Queue
A dashboard becomes operational when every important signal can become a queue item. That does not mean every warning deserves a ticket. It means the dashboard should make the decision explicit: fix, refresh, consolidate, monitor, escalate, or ignore for now.
Use these fields for the queue:
| Queue field | Example |
|---|---|
| Page cohort | Blog posts in a content hub, localized product pages, or a technical template |
| Trigger | Clicks fell while impressions held, crawl errors rose, or AI citations disappeared |
| Evidence | Query family, affected URLs, crawl finding, AI answer observation, or release note |
| Likely cause | Snippet mismatch, technical access issue, intent drift, content gap, or market change |
| Owner | SEO, content, engineering, product marketing, or regional team |
| Action | Rewrite snippet, fix canonicals, add internal links, refresh section, merge pages, or watch |
| Validation window | Next crawl, next reporting cycle, or a specific date after release |
The validation window is the part many dashboards skip. Without it, every report rediscovers the same problem. With it, the team can ask whether the shipped change produced the expected leading signal.
Where Searvora Fits
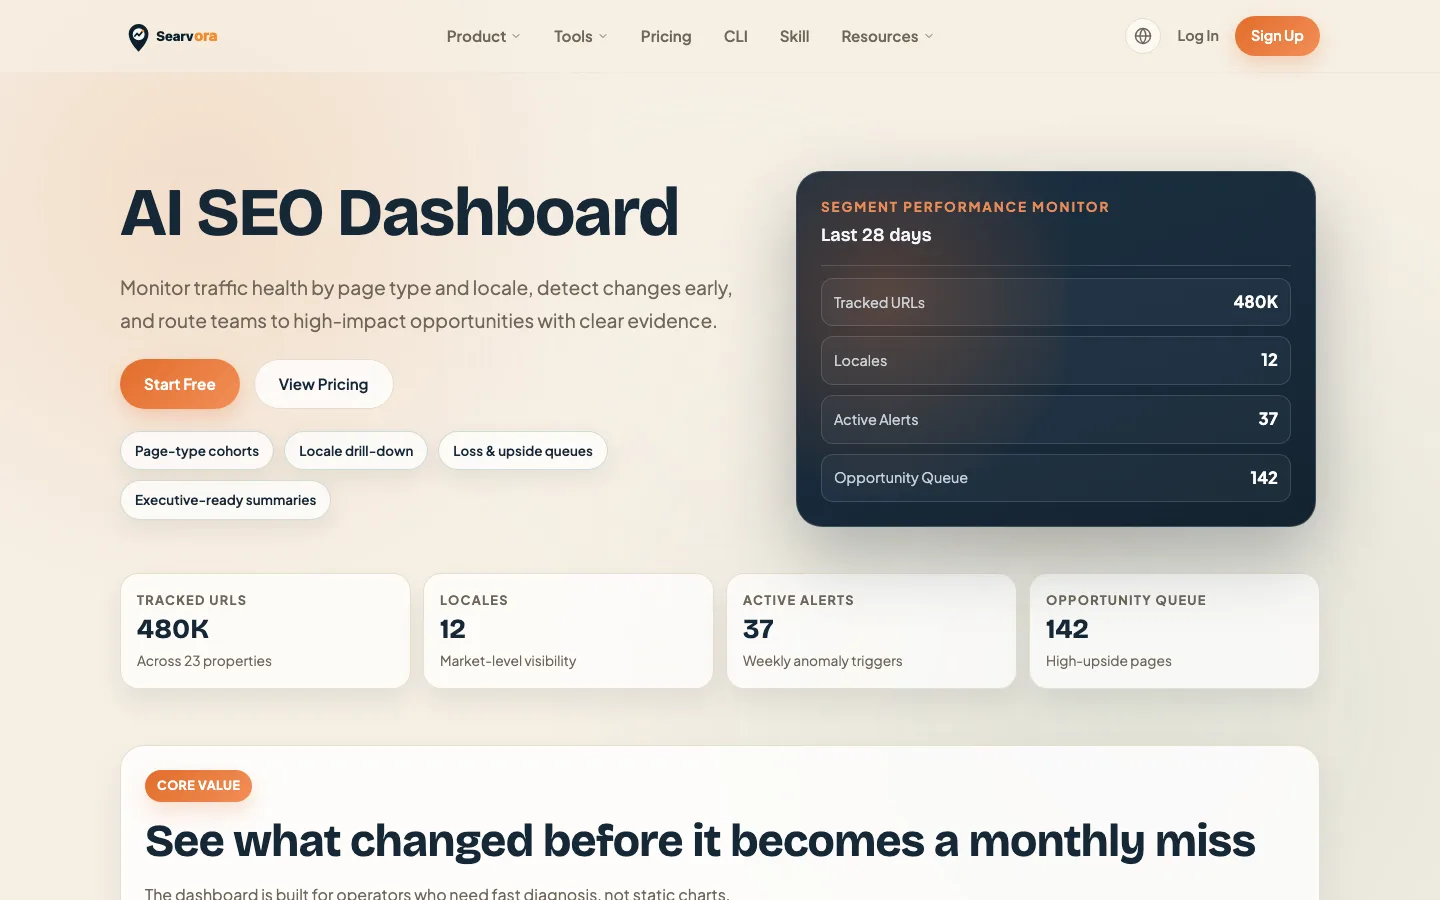
Searvora's AI SEO dashboard fits the monitoring and action-routing layer of this workflow. The public product page positions it around page-type cohorts, locale drill-down, loss and upside queues, and executive-ready summaries. That is the layer most SEO reporting dashboards need when a team wants to move from "what changed" to "what should ship next."
Use Searvora to group signals by page cohort, then route each finding into the right execution path:
| Dashboard finding | Better Searvora handoff |
|---|---|
| A page group lost clicks but kept impressions | Review snippet, intent, and page promise before rewriting |
| A technical template gained crawl warnings | Send the URL set to crawler validation and owner assignment |
| AI-search visibility changed by topic cluster | Identify the source-page gaps and prioritize answer-ready edits |
| A content group stalled | Decide whether to refresh, consolidate, expand, or leave it alone |
| A stakeholder needs a status view | Summarize shipped work, current blockers, and next validation window |
SEO Reporting Dashboard Checklist
Use this checklist before trusting the dashboard:
- Name the decision the dashboard should improve.
- Segment pages by type, directory, locale, market, template, or owner.
- Separate demand, snippet, crawl, AI-search, and revenue evidence.
- Show affected URLs or page groups, not only sitewide averages.
- Keep every core metric tied to a possible action.
- Add owner, status, and validation fields to important findings.
- Link technical findings to crawl evidence before rewriting content.
- Link AI-search findings to source pages, citations, and answer-ready edits.
- Remove widgets that never change priority or ownership.
- Review whether the next reporting cycle confirmed the shipped fix.
An SEO reporting dashboard is worth building when it shortens the path from signal to decision. Start with the page cohorts and user jobs, add the evidence layers that change action, and make every important widget end with an owner and a validation plan.