

SEO reporting tools are not interchangeable. One tells you how Google presents a verified site in Search. Another adds on-site behavior and conversion context. A crawler explains whether a technical pattern may be behind the movement. A reporting layer then has to turn all of that evidence into a decision someone can own.
The useful stack is compact. Start with a first-party search source, add behavior context, make the reporting view shareable, bring in crawl evidence when the signal needs an explanation, and keep one action layer that records priority, owner, and validation date. This roundup compares five SEO reporting tools by that job—not by a generic feature checklist.
The 5 SEO Reporting Tools at a Glance
| Tool | Best reporting job | Evidence it contributes | Main limit to plan around |
|---|---|---|---|
| Google Search Console | Search performance and indexing review | Queries, pages, clicks, impressions, CTR, position, and index signals for verified properties | It does not explain user behavior after the click or replace a technical crawl |
| Google Analytics | Site behavior and business context | Website and app reports that help investigate traffic and user activity | It is not a source of Google Search query or indexing evidence |
| Google Looker Studio | Shareable report assembly | Connected data sources, interactive reports, dashboards, and distribution | A polished view still needs an owner and a defined response to change |
| Screaming Frog SEO Spider | Technical cause investigation | Crawl findings across links, metadata, directives, rendering, and site structure | The free edition has a 500-URL crawl limit, and exports still need interpretation |
| Searvora AI SEO Dashboard | Action-ready SEO monitoring | Page-type and locale segmentation, anomaly context, opportunity scoring, and execution handoff | It works best when the team agrees on segments, priorities, and validation windows |
1. Google Search Console for Search Performance Evidence
Google Search Console should be the first tab in an SEO reporting workflow when the question is about visibility in Google Search. Its public Search Console overview describes measuring Search traffic and performance, reviewing impressions, clicks, and position, submitting sitemaps, and investigating crawl and index information.
Use it to identify the slice that deserves attention:
- Pages with high impressions and weak CTR.
- Query groups that have lost clicks or visibility.
- Directories or templates with an indexability or crawl signal.
- Country, device, or search-appearance segments that moved differently from the site average.
Search Console is strongest when it gives the report a precise scope. It cannot by itself tell you whether a decline comes from a template, content mismatch, conversion problem, or technical change. The next tool should answer that narrower question instead of collecting another broad metric.
2. Google Analytics for Behavior and Conversion Context
Use Google Analytics when the report needs to move from “did search visibility change?” to “what happened after people arrived?” The official Google Analytics reporting overview describes reports for monitoring traffic, investigating data, and understanding website and app users and their activity.
That makes it a useful companion to Search Console, not a substitute for it. Pair the two when a page gained impressions but produced weak engagement, when a landing-page change may have affected a conversion path, or when a traffic shift needs a business-context check.
Do not collapse every metric into one score. Keep the reporting question explicit: search demand, landing-page behavior, conversion completion, or a technical eligibility issue. A team can then assign the right owner instead of asking one SEO report to diagnose everything.
3. Google Looker Studio for Shareable Reporting Views

Google Looker Studio is the presentation layer when a recurring SEO review needs a consistent, shareable view. Its public overview describes connecting data sources, building interactive reports and dashboards, and sharing them with individuals or teams.
Use it when the underlying sources are already known and the team needs a stable reporting cadence. A useful SEO view usually has a small number of sections:
- Search performance by page type, directory, locale, or market.
- A short list of material gains and losses.
- Technical or content evidence that explains the largest movements.
- A decision log with owner, expected impact, and next validation date.
The failure mode is treating a dashboard as the endpoint. A distribution-ready report is valuable only if its audience can see what will change before the next review.
4. Screaming Frog SEO Spider for Crawl Evidence
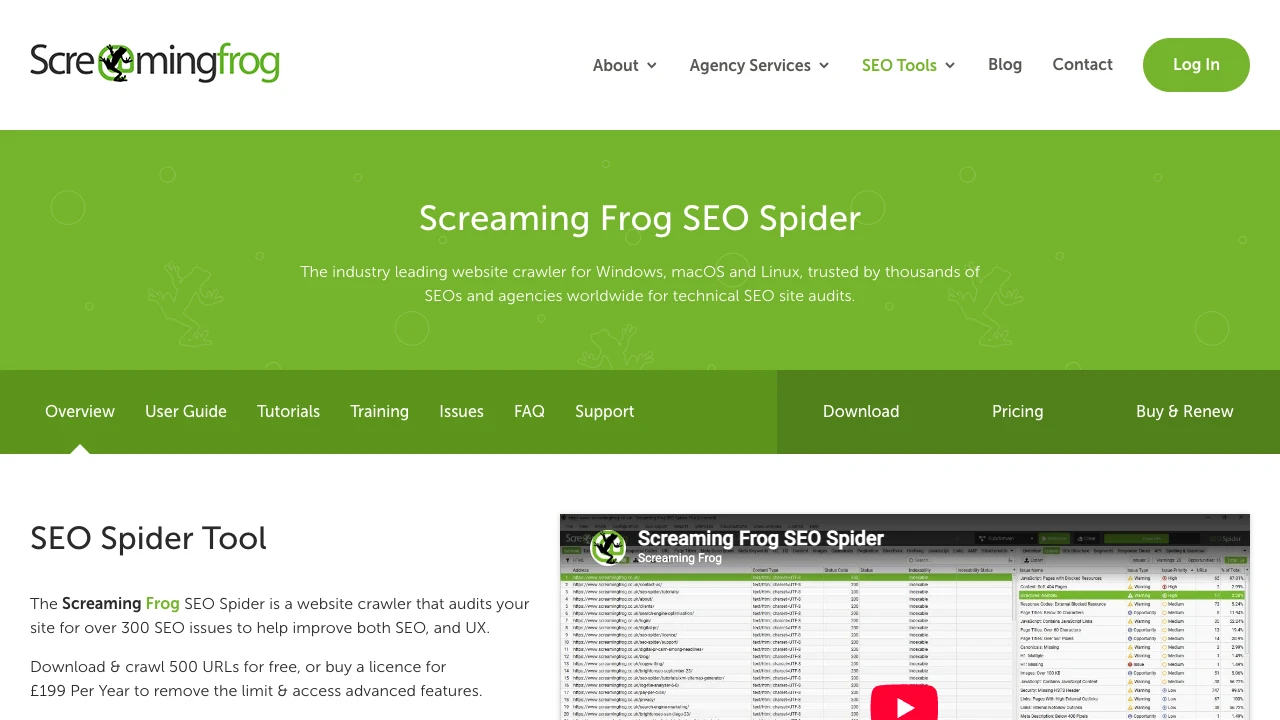
Screaming Frog SEO Spider belongs in a reporting stack when performance data points to a technical question. Its official SEO Spider page describes a crawler for technical SEO site audits, including links, redirects, metadata, directives, rendering, and structure. The same page states that the free edition can crawl up to 500 URLs per crawl.
Use crawl evidence to test a hypothesis, not to fill a report with warnings. For example:
| Search signal | Crawl question | Evidence to hand off |
|---|---|---|
| A template loses impressions after a release | Did status codes, canonicals, indexability, titles, or rendered content change across the affected template? | Affected URL sample, pattern, likely owner, and a recrawl window |
| A directory has weak CTR | Are titles, descriptions, headings, or duplicate patterns consistent across the page set? | Template-level metadata examples and a rewrite or QA brief |
| Important pages are not appearing as expected | Are internal links, sitemaps, directives, or canonical signals conflicting? | Discovery path, conflicting signals, and a validation checklist |
The crawler should shrink uncertainty. Export only the evidence that changes a decision; then reserve the next report for whether the shipped fix changed the original signal.
5. Searvora AI SEO Dashboard for the Action Queue
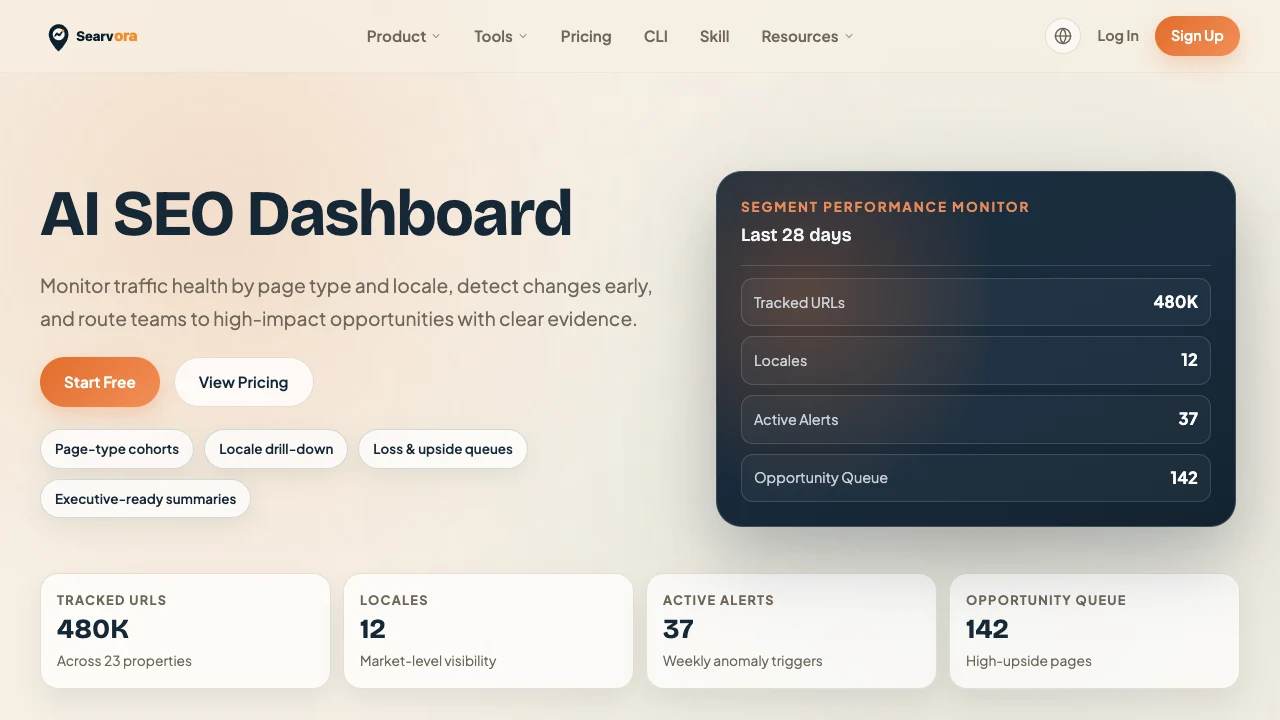
Searvora's AI SEO Dashboard is useful once the team needs to connect a reporting signal to an execution path. Its public product page positions the dashboard around monitoring traffic health by page type and locale, detecting changes early, and routing high-impact opportunities with clear evidence.
Use it when a weekly report needs a decision layer:
- Segment the movement by page type, locale, directory, or template.
- Separate a minor fluctuation from a repeatable anomaly.
- Rank the affected pages by upside, confidence, and likely effort.
- Send the context to SEO, content, or engineering with an owner and acceptance check.
- Re-check the same segment after the change ships.
This is a different job from collecting every source in one place. The goal is to make the reporting meeting end with an agreed queue rather than a list of charts that must be interpreted again next week.
Turn the Stack Into a Report-to-Fix Loop
The five tools work best as a sequence.
| Cadence step | Question | Tool emphasis | Output |
|---|---|---|---|
| Detect | What changed materially? | Search Console plus Searvora segments | A defined page, query, locale, or template slice |
| Explain | Is the movement behavioral, technical, or content-related? | Google Analytics and SEO Spider | A short evidence pack, not a raw export |
| Decide | Which action is worth shipping first? | Searvora AI SEO Dashboard | Priority, owner, effort, and acceptance check |
| Communicate | What does each stakeholder need to know? | Looker Studio or a concise operating report | A review view with linked evidence and actions |
| Validate | Did the change affect the original signal? | The same source mix, with a defined comparison window | A keep, iterate, or rollback decision |
For the reporting document itself, start with an SEO report template that includes source, page cohort, owner, action, and validation date. Once the inputs and segments are stable, add automated SEO reporting so recurring reviews do not depend on rebuilding the same spreadsheet every week.
A Short Selection Checklist
Choose an SEO reporting tool based on the decision it will improve:
- Start with first-party search evidence when the question is visibility or indexing.
- Add analytics when the decision depends on post-click behavior or conversion context.
- Use a crawler when a page group needs a technical explanation.
- Use a shareable dashboard only after the source metrics and ownership model are clear.
- Keep an action layer that records the affected segment, owner, expected result, and validation date.
The best SEO reporting stack is not the one with the most widgets. It is the one that lets a team move from a verified signal to a focused fix and then prove whether that fix worked.