
Site architecture crawl visualization is the work of turning a crawl graph into decisions about depth, links, templates, indexability, and fixes. The graph is useful only when it changes what the team does next.
A crawl map can make a site feel understandable in seconds. It can also mislead a team if everyone admires the shape and skips the underlying evidence. The practical workflow is to use the visualization as a triage layer, then confirm each pattern with crawl depth, inlinks, canonicals, noindex rules, sitemap coverage, and page value.
The Screaming Frog site architecture visualization guide that surfaced this opportunity separates crawl visualizations from directory tree visualizations and makes a useful point: visuals can reveal patterns that spreadsheets hide, but they do not add new crawl data on their own. Searvora's information gain is the operating layer after that insight: turn the pattern into a fix queue, assign an owner, and recrawl to prove the architecture improved.
Use The Graph As A Triage Layer
Start by asking what the visualization is allowed to decide. It should not replace crawl data, Search Console evidence, analytics, or editorial judgment. It should help the team see where to look first.
Use the graph to spot these architecture patterns:
| Pattern in the visualization | What it may mean | Evidence to confirm |
|---|---|---|
| Important pages sit far from the start URL | Valuable content may be too deep | Crawl depth, inlinks, traffic value, and internal-link source pages |
| A large section branches away from the main path | The site may have a silo or orphan-prone area | Section crawl inventory, sitemap overlap, and contextual links |
| Many nodes in one area are non-indexable | A template, canonical, or robots pattern may affect a whole group | Indexability state, canonical target, meta robots, and status codes |
| One directory creates a dense cluster | Template or parameter rules may be creating crawl noise | URL patterns, duplicate titles, parameters, and canonical clusters |
| Important pages are visually isolated | Internal links may not explain where the page belongs | Inlink count, anchor text, source-page relevance, and crawl depth |
This is where the graph becomes stronger than a screenshot. A pretty cluster is not a diagnosis. A cluster tied to a template, crawl depth, indexability state, and owner is work the team can ship.
Know Which Visualization You Are Reading
Crawl visualizations and directory tree visualizations answer different questions. Mixing them together is how teams choose the wrong fix.
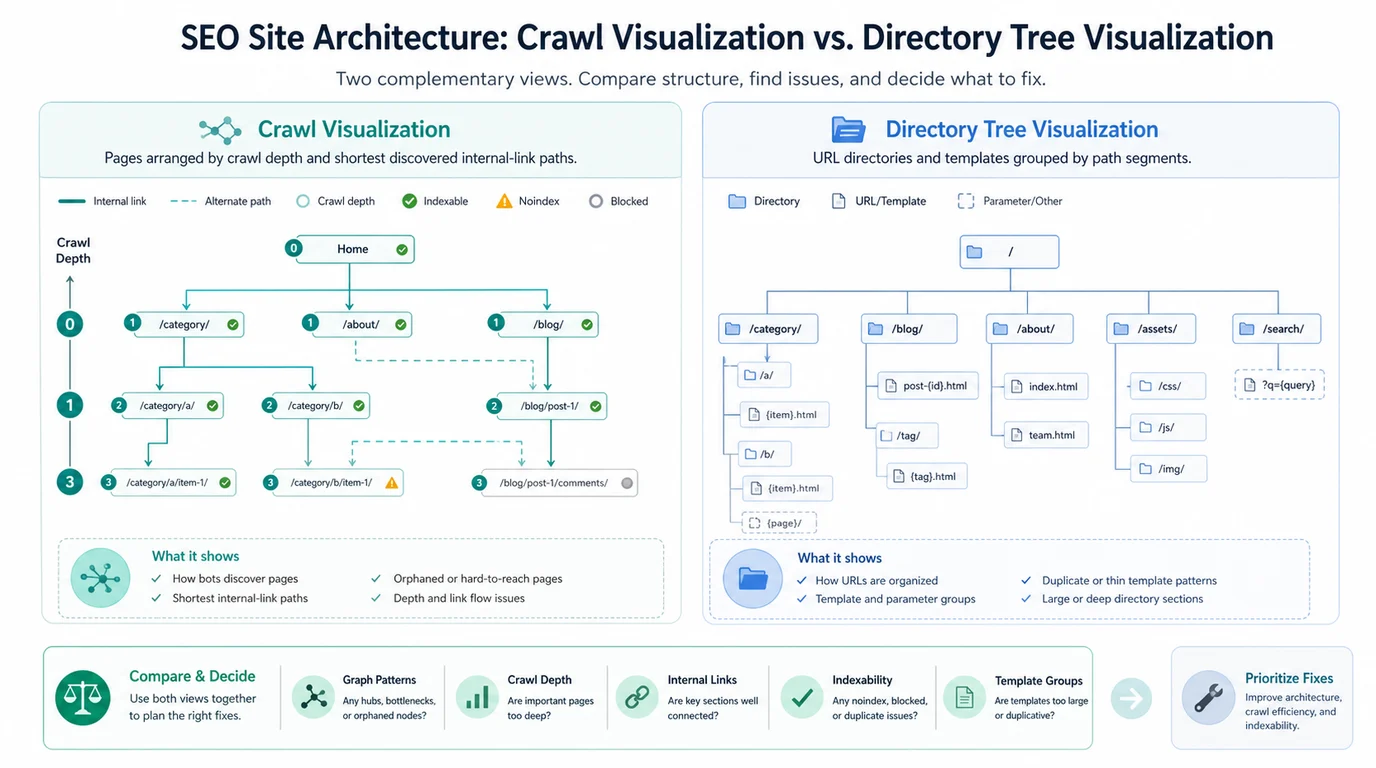
A crawl visualization shows how the crawler discovered URLs through internal links. It is useful for shortest paths, crawl depth, isolated sections, and pages that depend on weak link routes. If a revenue page appears too deep, the likely fix may involve navigation, hub links, related content, breadcrumbs, or contextual links.
A directory tree visualization groups URLs by path. It is useful for template families, parameter patterns, faceted paths, international folders, blog taxonomies, and sections that share technical behavior. If a whole directory looks noisy, the fix may involve URL rules, canonicals, noindex policy, sitemap cleanup, or template-level metadata.
Use this quick split:
| Question | Better first view | Why |
|---|---|---|
| Can crawlers reach this page through useful internal links? | Crawl visualization | The discovery path and depth are the point |
| Which folders or templates create indexation noise? | Directory tree visualization | Path grouping makes template patterns easier to see |
| Where should a hub or breadcrumb link point? | Crawl visualization | You need to understand link paths and support |
| Which URL patterns deserve a canonical or noindex review? | Directory tree visualization | Similar paths often share the same technical rule |
| Did a new internal-link batch change discovery? | Crawl visualization | A recrawl should show the path change |
The URL structure SEO workflow is the natural companion when the directory view reveals confusing paths. The internal links for SEO process is the better companion when the crawl view shows weak discovery or shallow support.
Confirm The Pattern Before You Fix It
The safest workflow is visual first, data second, fix third. If the graph suggests an issue, pull the crawl fields that can prove or disprove it.
Google's link best practices are the baseline for internal architecture: links need crawlable destinations and useful anchor text. A visualization can show weak paths, but the fix still has to improve real links that users and crawlers can follow.
Use this validation checklist before assigning work:
- Confirm the affected URLs return the expected status code.
- Check whether the pages are indexable, canonical, and allowed by robots rules.
- Compare crawl depth with page importance.
- Review inlinks and anchor text from source pages.
- Check whether the pages are present in the XML sitemap.
- Group the issue by directory, template, page type, or owner.
- Decide whether the right fix is a link, redirect, canonical, noindex rule, content update, template change, or sitemap cleanup.
- Save the before-state so the next crawl can prove whether the fix worked.
Google's sitemap documentation is useful here because it keeps sitemap inclusion in perspective. A sitemap can help discovery, but it is not a replacement for a clean internal architecture. If a page appears in the sitemap but never appears in the crawl path, that difference is a review queue, not a reason to ignore internal links.
Prioritize Architecture Fixes By Page Value
Not every strange shape deserves engineering time. Large sites always contain deep pages, utility sections, old campaign URLs, and directories that look messy in a graph. The question is whether the pattern affects pages that should earn search demand, support conversions, or help users navigate.
Use this prioritization table:
| Architecture finding | Prioritize when | Usually monitor when |
|---|---|---|
| Deep important pages | The pages target valuable search demand or support conversion paths | The pages are low-value archives or intentional support pages |
| Isolated content clusters | The section has active demand, links, or product relevance | The section is intentionally private, deprecated, or low-priority |
| Non-indexable clusters | The rule affects pages that should be eligible for search | The pages are filters, account pages, internal search, or duplicates |
| Template-level metadata gaps | The template powers many indexable pages | The template is small, blocked, or already being replaced |
| Sitemap-only URLs | The URL should be discoverable through normal navigation | The URL is a low-value utility page or temporary campaign state |
For orphan-style patterns, use the orphan pages workflow before adding random links. An orphan fix should connect the page to the correct parent, hub, collection, or related guide. A sitewide footer link can make the graph look better while doing little for user context.
For broader technical issues, pair the graph with the technical SEO audit process. Crawl visuals are a fast way to find patterns, but technical SEO still needs status, canonical, hreflang, rendering, structured data, and performance checks when those signals affect the same templates.
Turn The Visualization Into A Fix Queue
A crawl graph becomes useful when it produces a queue with severity, owner, evidence, and validation criteria. Without that queue, the audit stays in presentation mode.
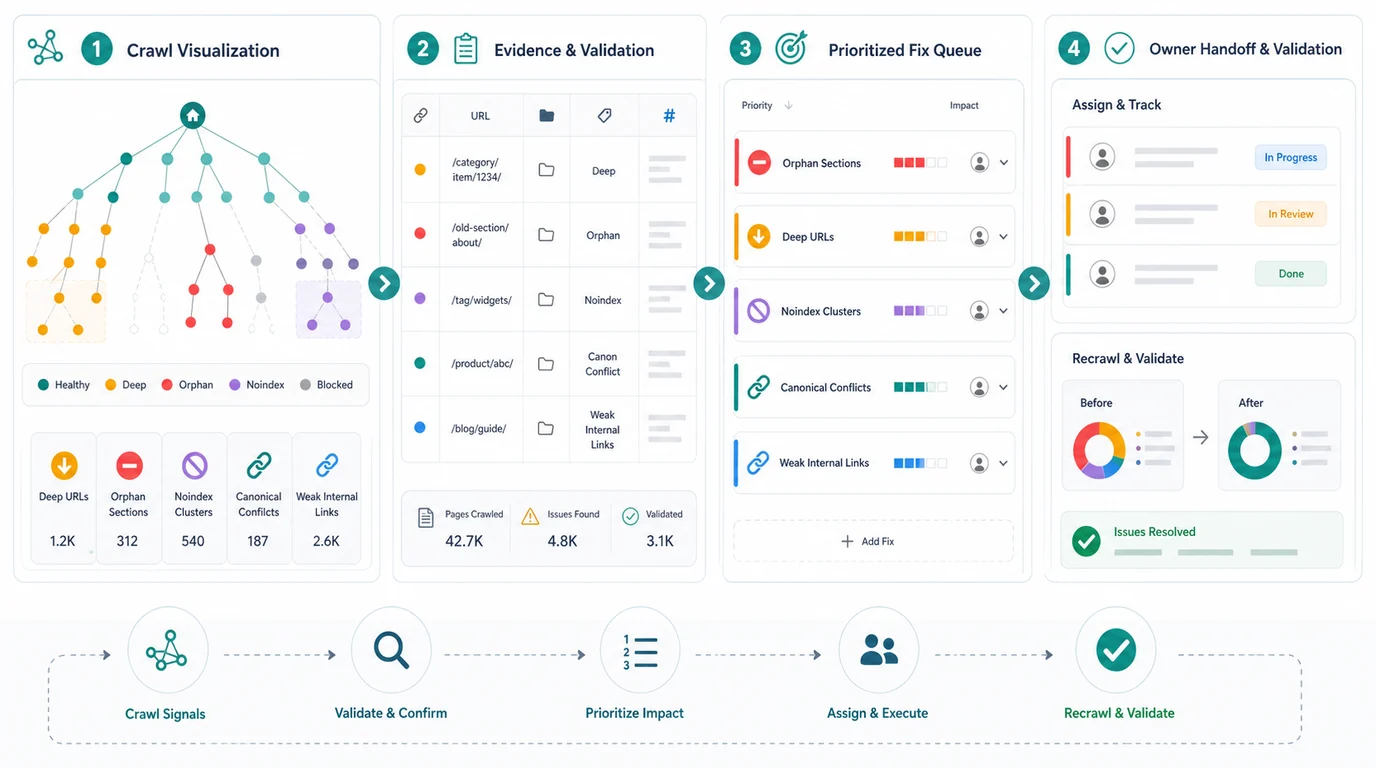
Use this handoff format:
| Queue field | What to record | Example |
|---|---|---|
| Pattern | What the visualization showed | Product guide cluster is three clicks deeper than related collections |
| Evidence | The crawl fields that prove it | Depth 5, one weak inlink, missing from hub, indexable canonical URL |
| Impact | Why the team should care | Guide supports category demand and has impressions but low clicks |
| Fix type | The likely action | Add contextual links from collection and buying guide hub |
| Owner | Who can ship it | Content, SEO, engineering, merchandising, or CMS owner |
| Validation | How success will be checked | Recrawl shows depth 3 and relevant inlinks from hub pages |
This format also prevents overreacting. A graph may highlight a large red cluster, but the fix could be "leave it noindexed" if the URLs are internal search, account pages, or duplicate filters. The goal is not to turn every node green. The goal is to make the architecture match the page jobs.
Where Searvora Fits
Searvora SEO Spider Crawler fits the evidence layer around site architecture visualization. Use it to crawl URLs, collect status codes, metadata, canonicals, robots signals, structured attributes, and link graphs, then group findings by severity, template footprint, and organic impact.
The product layer matters after the pattern is visible:
| Workflow step | Searvora role | Output |
|---|---|---|
| Crawl the site | Collect URL inventory, depth, inlinks, metadata, canonicals, and sitemap signals | Baseline architecture evidence |
| Compare views | Separate link-path problems from directory/template problems | Correct fix type |
| Cluster issues | Group findings by section, template, severity, and business value | Prioritized review queue |
| Assign fixes | Turn the evidence into owner-ready tasks | SEO, content, and engineering handoff |
| Recrawl | Validate that links, rules, and templates changed as intended | Before-and-after proof |
AI SEO Consultant can help when the graph creates judgment calls: should this section become a hub, should two clusters merge, should a template be noindexed, or should a page get more internal links? Keep the workflow honest. The consultant can help prioritize, but the next crawl still has to prove the architecture changed.
Site Architecture Crawl Visualization Checklist
Use this checklist whenever a crawl graph becomes part of an SEO audit:
- Name the visualization type before interpreting it.
- Write down the pattern the graph appears to show.
- Pull the crawl fields that can confirm or reject the pattern.
- Separate crawl-path issues from directory/template issues.
- Check indexability, canonicals, robots rules, and status codes.
- Compare page importance with crawl depth and inlink support.
- Review sitemap-only pages instead of assuming the sitemap is enough.
- Group issues by owner and fix type.
- Prioritize fixes by page value, template footprint, and confidence.
- Recrawl after changes and compare the graph with the original evidence.
A site architecture visualization is not the audit. It is the fastest way to notice where the audit should look. The value comes when the team connects that visual pattern to crawl evidence, chooses the right fix, and proves the next crawl is cleaner.